Note
Go to the end to download the full example code.
Adding Chan-Vese Contours to an Image#
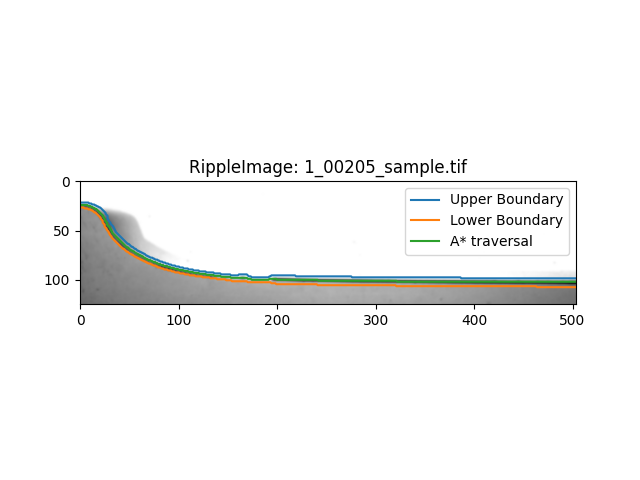
This example shows how to add a contour based on an A-star traversal of the image in an area between two existing contours.
This is useful as a method to produce an average path between two contours, for example the ‘upper’ and ‘lower’ boundaries of a ripple. Since it is common for waves to have a shape that is multivalued then a normal averaging method will not effectivey capture the average shape of the two contours.
We can load an image into a RippleImage object using the RippleImage class and then run add_boundary_contours to add our limits for the A* contour to the image.
import matplotlib.pyplot as plt

from ripplemapper.analyse import add_a_star_contours, add_boundary_contours
from ripplemapper.classes import RippleImage
from ripplemapper.data.example import example_data

ripple_img = RippleImage(example_data[1])
add_boundary_contours(ripple_img)
From here we can run add_a_star_contours to add the A* contour that uses these two boundaries as its limits.
add_a_star_contours(ripple_img)
Plotting the image and its contours
ripple_img.plot(include_contours=True)
plt.show()
Total running time of the script: (0 minutes 0.099 seconds)