Note
Go to the end to download the full example code.
Plotting a timeseries of a contour#
A RippleImageSeries is simply a container class for a list of RippleImages.
This example demonstrates how to plot a RippleImageSeries using inbuilt plotting methods.
from matplotlib import pyplot as plt

from ripplemapper.analyse import (add_a_star_contours, add_boundary_contours,
                                  add_chan_vese_contours)
from ripplemapper.classes import RippleImageSeries
from ripplemapper.data.example import example_dir
from ripplemapper.io import load_dir_to_obj
We can create a list of RippleImages from a list of image files. In this example we use the load_dir_to_obj method to load all images in a directory into RippleImage objects.
Passing this list to the RippleImageSeries constructor will create a RippleImageSeries object.
ripple_images = load_dir_to_obj(example_dir)
series = RippleImageSeries(ripple_images)
add_boundary_contours(series, sigma=2)
add_a_star_contours(series)
add_chan_vese_contours(series)
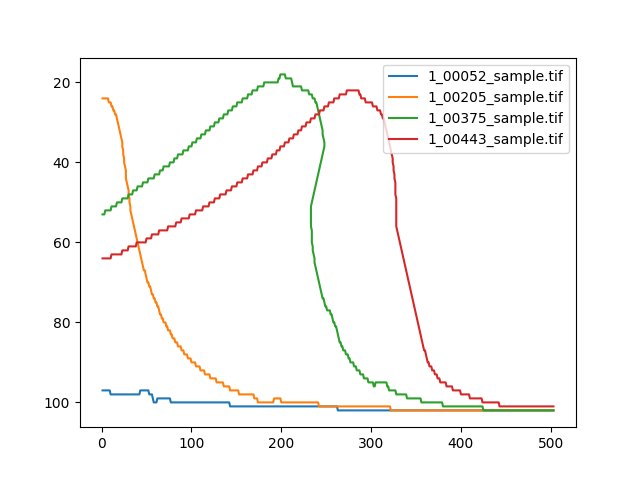
We can plot a timeseries of this object, showing how the same contour evolves over time.
We can refer to the contour via index:
series.timeseries(1)
plt.show()

or via the method name:
series.timeseries('A* traversal')
plt.show()
Total running time of the script: (0 minutes 5.322 seconds)