Note
Go to the end to download the full example code.
Plotting a RippleImage#
How to plot a ripple image using inbuilt plotting methods.
from matplotlib import pyplot as plt

from ripplemapper.analyse import add_boundary_contours
from ripplemapper.classes import RippleImage
from ripplemapper.data.example import example_data

ripple_img = RippleImage(example_data[2])
add_boundary_contours(ripple_img, sigma=2)
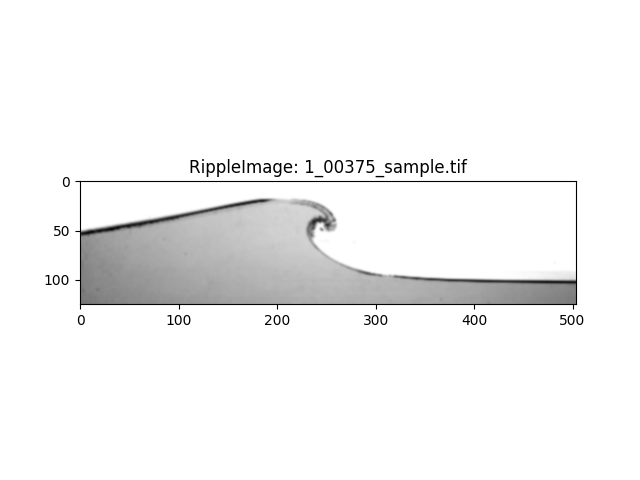
We can plot the image by calling RippleImage.plot.
ripple_img.plot(include_contours=False)
plt.show()
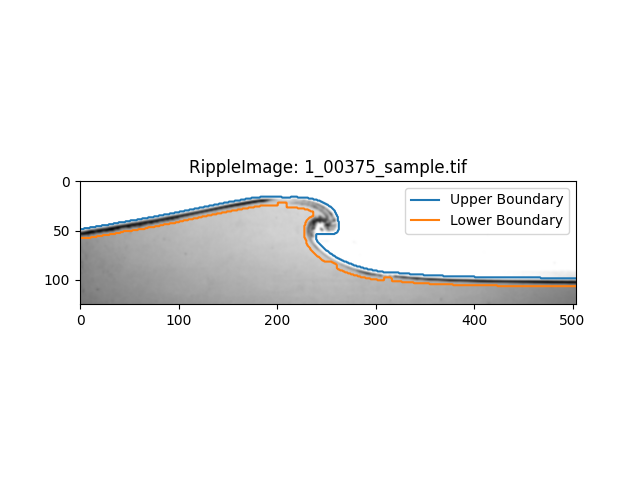
If there are contours on the image, we can plot the contours (enabled by default).
ripple_img.plot(include_contours=True)
plt.show()
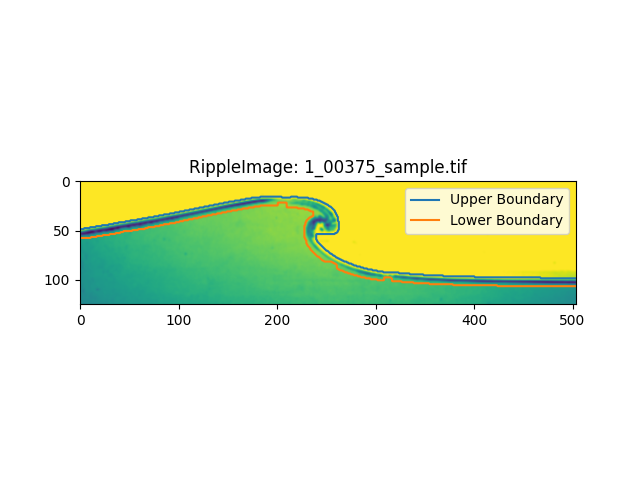
We can pass any matplotlib.pyplot.imshow arguments to the plot method.
ripple_img.plot(include_contours=True, cmap='viridis')
plt.show()
Total running time of the script: (0 minutes 0.164 seconds)