Note
Go to the end to download the full example code.
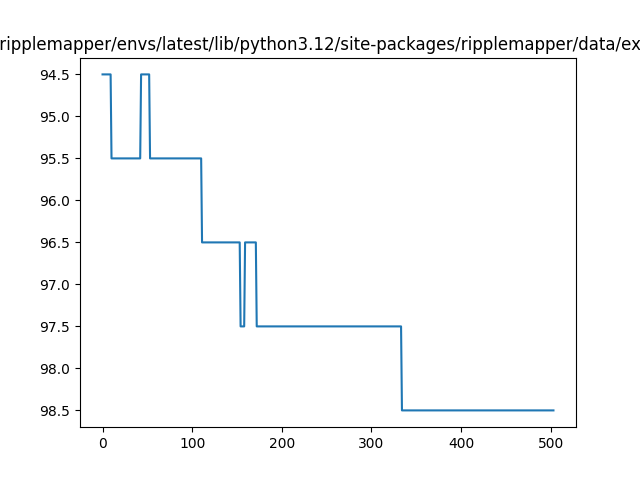
Plotting a RippleContour#
How to plot a RippleContour using inbuilt plotting methods.
from matplotlib import pyplot as plt

from ripplemapper.analyse import add_boundary_contours
from ripplemapper.classes import RippleImage
from ripplemapper.data.example import example_data

ripple_image = RippleImage(example_data[0])
add_boundary_contours(ripple_image, sigma=2)
Plot with RippleContour.plot.
ripple_image.contours[1].plot()
plt.show()
Total running time of the script: (0 minutes 0.061 seconds)